Contents
- Blog
- Wireless
Inside SoftBank’s Research Institute of Advanced Technology: My Internship Journey in 5G Network Data Analysis
Roshni Gundavelli
#6G #Massive MIMO #Internship
Aug 21, 2025
SoftBank Corp.
1. Introduction
As a sophomore studying computer science at University of California, Santa Cruz with a passion for wireless communication and AI technologies, I was thrilled to be offered the opportunity to travel to Tokyo, Japan and work with the SoftBank Research Institute of Advanced Technology, where I gained hands-on experience with cutting edge projects in Massive MIMO (Multiple Input Multiple Output) and wireless signal data visualization and analysis. Over the course of my two-month summer internship, I had the chance to collaborate with multiple departments—Wireless Systems, 6G Preparation, and Business Planning—with each offering unique opportunities to broaden my skillset. In this article, I will walk through the projects I completed and their contribution to SoftBank’s R&D efforts, as well as my thoughts on the department and its culture, as an American teenager experiencing Japan’s tech industry for the first time.
2. Internship Overview
Before starting the internship, I had a background in computer science, including experience in programming and machine learning models, along with a brief understanding of networking concepts. With these basic skills, I started my internship journey in the Wireless Systems Department with detailed lectures that exposed me to the world of wireless communication and 5G networks I was about to dive into. With this foundation, I began hands-on work with network performance testing using iPerf and Spirent TestCenter, which allowed me to learn how to evaluate IP performance under different conditions. I then progressed to more complex tasks where I processed and visualized real Massive MIMO data to analyze per-UE (User Equipment) wireless performance metrics. Now equipped with the knowledge of these high-level concepts along with data processing and analysis capabilities, I moved to the 6G Preparation Department. Here, I was introduced to much more advanced topics such as multiple access methods and signal types in 5G as well as various propagation models. I then began several projects in visualizing real drive test measurement data and creating propagation models to analyze signal behavior. Lastly, I shifted to the Business Planning department, where I was faced with creative and corporate-facing tasks including article writing and editing as well as providing input on published content. From foundational learning to advanced projects to corporate communications, this internship gave me a comprehensive view of R&D at a leading tech company.
3. Network Data Analysis Projects
I will now explain my projects in detail, highlighting the data visualizations I created and the key insights uncovered through my analysis.
1. Massive MIMO Data Visualization
For this project I processed and analyzed performance metrics of Massive MU-MIMO (Multi-User) cellular system data, using Python, to evaluate wireless characteristics such as throughput, Modulation Coding Scheme (MCS), and Block Error Rate (BLER).
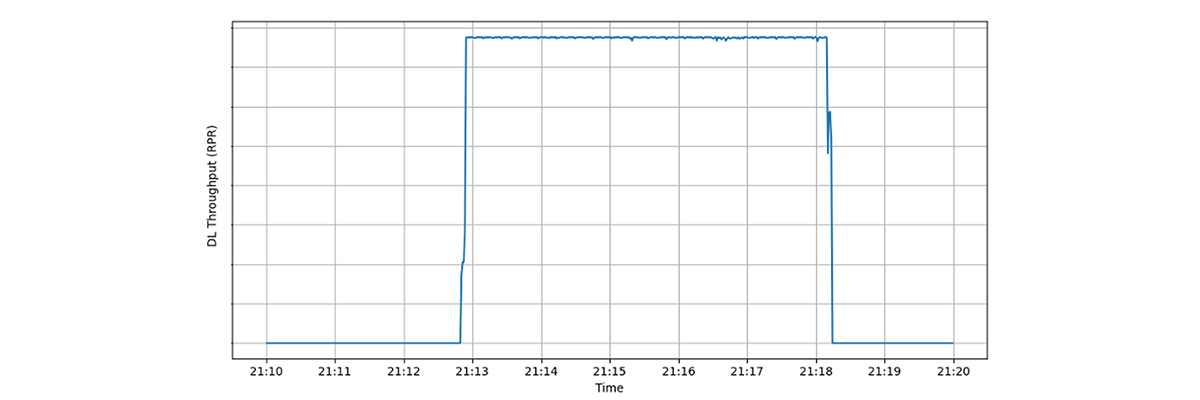
Downlink Throughput (RPR) Over Time
An important factor I considered when analyzing this graph was that the theoretical MU-MIMO throughput is around 1.5 times larger than the theoretical SU-MIMO (Single-User) throughput. Based on these baseline values and the graph, we can see that from the duration of around 21:13–21:18 the throughput exceeded the MU-MIMO theoretical throughput, representing a significant improvement over the SU-MIMO baseline. This clearly demonstrates the performance benefits of MU-MIMO, confirming that the cell is achieving the expected throughput given the available resources and Massive MU-MIMO configuration to maximize spectral efficiency.
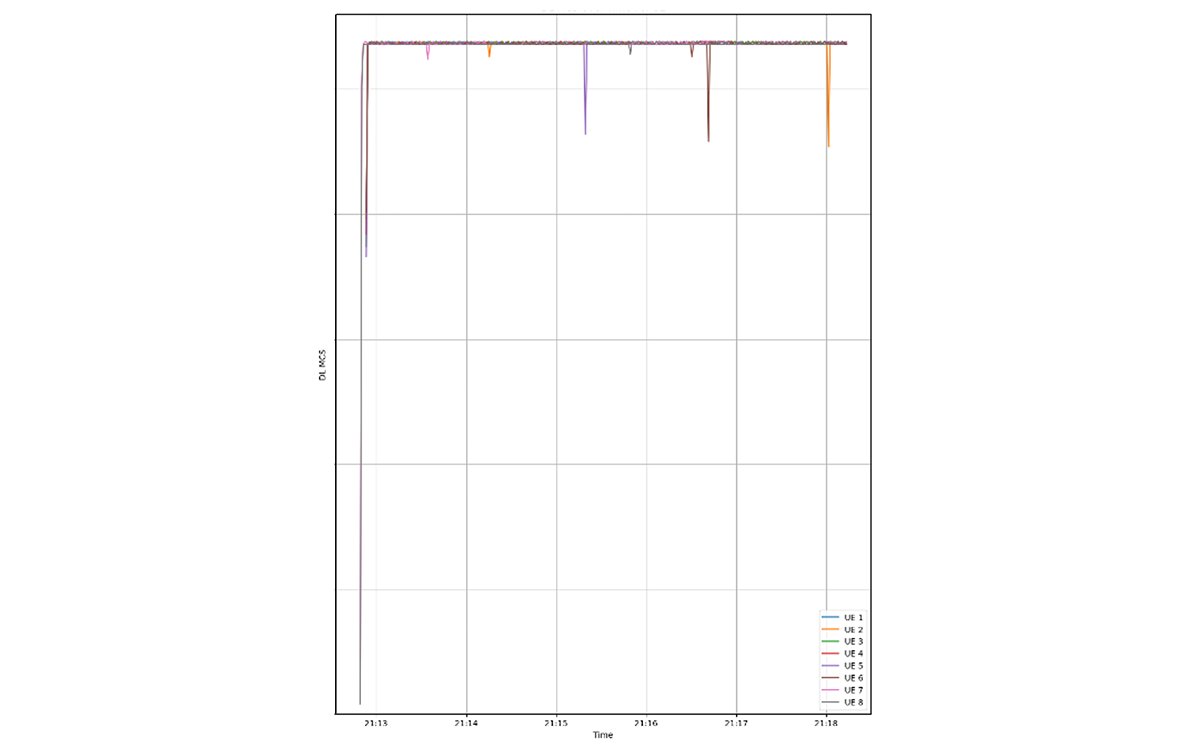
MCS Over Time Per UE
Higher MCS values on this graph indicate strong radio conditions and high throughput, whereas lower values suggest degraded conditions caused by noise, interference, or distance from the antenna. With this in mind, we can observe that most UEs are operating at a high MCS value, indicating efficient throughput per block and strong radio conditions, however, the occasional dips suggest momentary degradation due to interference, mobility, or beamforming misalignment. One interesting case is UE 8, which starts with an MCS near 0 and then proceeds to spike to a high MCS value. This shows that the UE started off with extremely poor connection and then improved significantly, possibly due to less interference, the UE moving to a better location, or Massive MIMO adaptations.
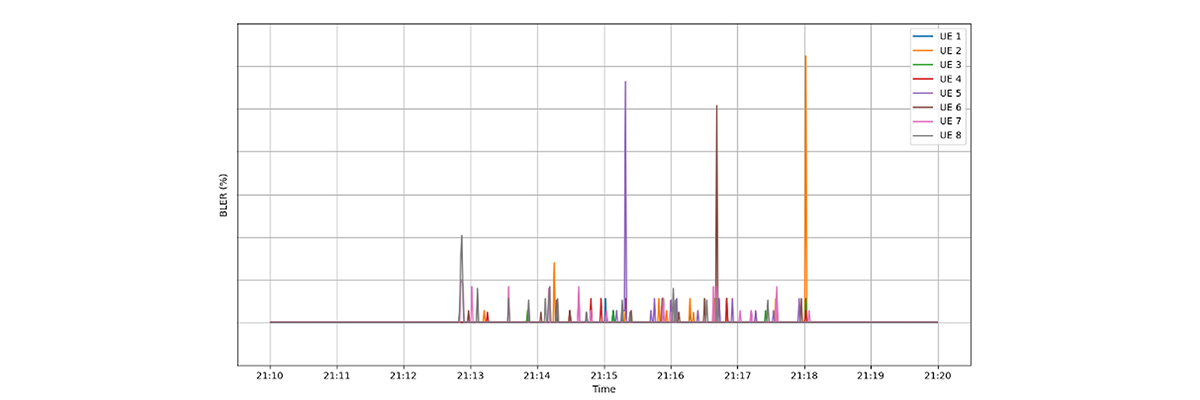
BLER Over Time Per UE
While a BLER value less than 10% is considered optimal, values too low can indicate an underutilization of capacity. In our data, all our values remain consistently near 0, which shows strong link quality, but also suggests that throughput is negatively affected to ensure reliability. Additionally, we can observe that BLER varies across UEs, indicating that beamforming and scheduling affect individual users differently in the same cell.
By visualizing user-specific performance to assess the link quality of each user and identify any UEs with poor channel conditions, I was able to contribute to SoftBank by offering guidance for potential optimization of beamforming, scheduling, and interference in Massive MU-MIMO.
2. RSRP Measurement Data & Propagation Model Visualization
In this project, I processed and visualized real drive test data, using Python, to compare measurements with ITU-R and FSPL (Free Space Path Loss) propagation models, evaluate signal behavior across two frequencies, and create geographic maps highlighting RSRP (Reference Signal Received Power) differences between them.
RSRP Data of 7 GHz Base Station with ITU-R & FSPL Propagation Model Predictions:
*[graph cannot be shown for security reasons]
The graph has a peak at around 60 meters and then has a decline that aligns accurately with the ITU-R model, showcasing that at larger distances, the ITU-R model accurately predicts signal strength. On the other hand, the FSPL model overestimates signal strength continuously and has a delayed decline, as seen by the widening gap between FSPL and ITU-R model predictions, resulting in a 50 dBm difference at 400 meters.
In order to analyze how signal behavior varies across the spectrum, I filtered the RSRP measurement data from the 7 GHz Base Station and the 3.9 GHz Base Station-operating in the same location-to ensure spatial proximity (data points with more than 5 meter 3D geodesic distance difference were removed).
Spatially Filtered RSRP data of 7 GHz and 3.9 GHz Base Stations:
*[graph cannot be shown for security reasons]
In the graph, the maximum RSRP values for both frequencies follow the same general trend, indicating that the overall signal behavior is consistent across these bands despite differences in frequency.
To provide a more intuitive and visual representation of RSRP data across different frequencies, I created geographic map visualizations to clearly show the varying signal strength on specific streets and locations between the two base stations.
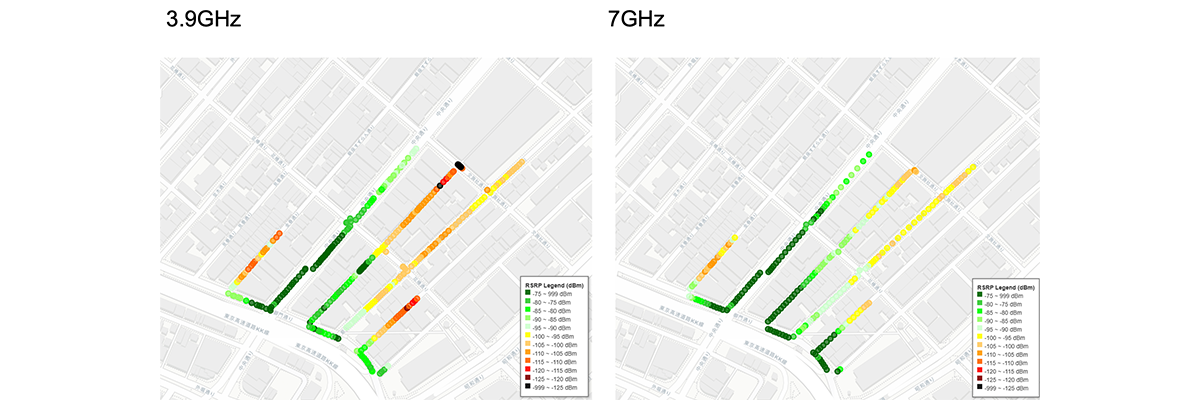
Geographic Map Graphs for 7 GHz Base Station & 3.9 GHz Base Station
While the two visualizations show similar patterns in color we can notice a few key differences in intensity across the map. In many areas, the 3.9 GHz Base Station shows oranges, reds, and blacks where the 7 GHz Base Station shows light yellows and some oranges. This indicates that despite following the same general trend, the signal strength is stronger at 7GHz than it is at 3.9GHz.
3. MCS and SINR Relationships in Base Station Data Visualizations
With the purpose of seeing how wireless testing performance metrics relate to one another, I created visualizations to observe how SINR (Signal-to-Interference-plus-Noise Ratio) impacts other signal behaviors like MCS from large-scale base station data.
MCS vs. SINR:
*[graph cannot be shown for security reasons]
This graph displays a positive relationship between raw signal strength and modulation data points, indicating that higher signal strength enables the system to use stronger modulation schemes. However, while almost all points in the graph follow this trend, it’s important to highlight the outliers in the -7 to -2 SINR range where MCS values are unusually high, possibly due to measurement noise or rare channel conditions.
To truly visualize this strong relationship, I filtered the data and graphed median MCS values against SINR to to smooth out variability and highlight the underlying trend.
Median MCS vs. SINR:
*[graph cannot be shown for security reasons]
This graph shows a positively sloped trend line, reinforcing the strong correlation between signal strength and modulation.
Overall, this project provided valuable insight into the signal strength across multiple frequencies, validated the accuracy of several propagation models, and offered key information for more effective network planning and optimization.
Through my base station data visualizations projects, I provided Mobile Network Operators (MNOs) with insights on coverage trade-offs and cost optimization, while contributing to SoftBank’s 6G network preparation efforts.
4. Business Planning Contributions
In my time in the Business Planning department, I had the opportunity to work on articles for publication on the official SoftBank homepage. As a native English speaker in a Japanese company, I was able to use my language skills to edit several articles including a manual on quantum technology and a feature on the SoftBank R&D US Site. Also, using my background in web and graphic design, I gave suggestions on the thumbnails and visual presentation of multiple published articles to enhance readability and general aesthetics. Overall, this experience offered me a great exposure into corporate communications and gave me a chance to apply my design skills to make direct contributions to the company’s external image.
5. Future Aspirations: Proactive Handover Prediction with Machine Learning
The knowledge I have gained in 5G networks, data analysis, and wireless technologies over the last two months has inspired me to begin researching projects of my own.
In specific, my hands-on experience with network performance metrics allowed me to recognize real-world challenges such as handover failure (HOF), a critical issue that can cause dropped calls, latency spikes, and overall poor user experience. To address this problem, I began exploring a project I would like to pursue this coming school year, using my newfound understanding of networking with my prior knowledge in machine learning: Proactive Handover Prediction with Machine Learning.
The goal of this project is to train a machine learning model to accurately predict the next target gNB (base station) for a device and the time until handover will be needed, using mobility patterns (speed and direction) and current strength trends (RSRP, SINR, and neighbor cell measurements). By anticipating handovers, this project aims to optimize beamforming and scheduling for the incoming UE and improve the user experience by reducing dropped calls and latency spikes.
6. Internship Highlights & Key Experiences
Over the course of my internship I’ve gotten so many opportunities to gain hands-on experience across a variety of technical activities. In the early stages of my internship, I was able to visit the SoftBank Data Center where I toured the massive server rooms and saw firsthand the equipment and ports I would be later using for network performance testing. Following this introduction to the hardware side of wireless networking, I then had the chance to participate in drive testing in Ginza, working alongside engineers. I observed how data is measured in a car with specialized measurement equipment and saw for myself how signal quality changes across locations. This experience not only allowed me to bridge theory with practice, but also provided critical context that prepared me to analyze drive test data effectively, deepening my understanding of real-world network behavior beyond the classroom. Additionally, I attended multiple high-level department meetings, where employees presented their ongoing projects and research. While these topics were very advanced, they provided me with valuable exposure to cutting-edge work in the field I aspire to work in.
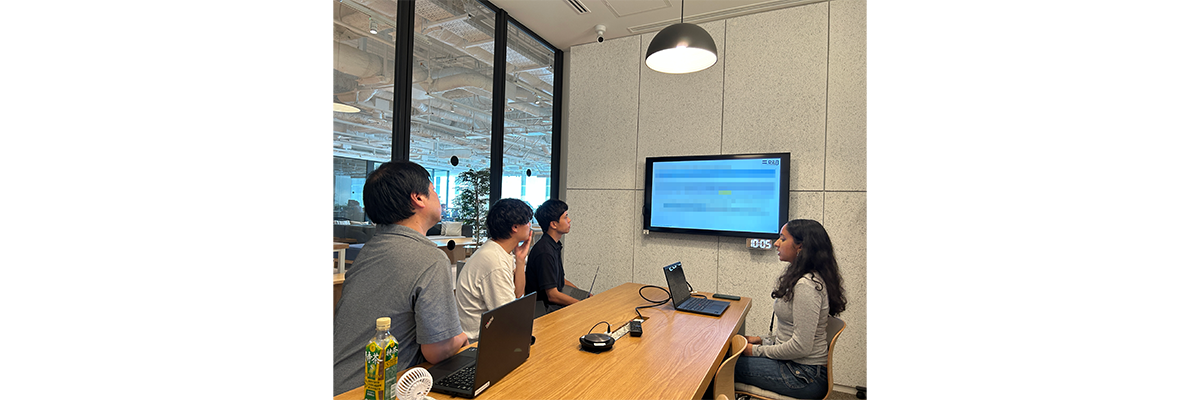
Presenting my findings to the Wireless Systems Department.
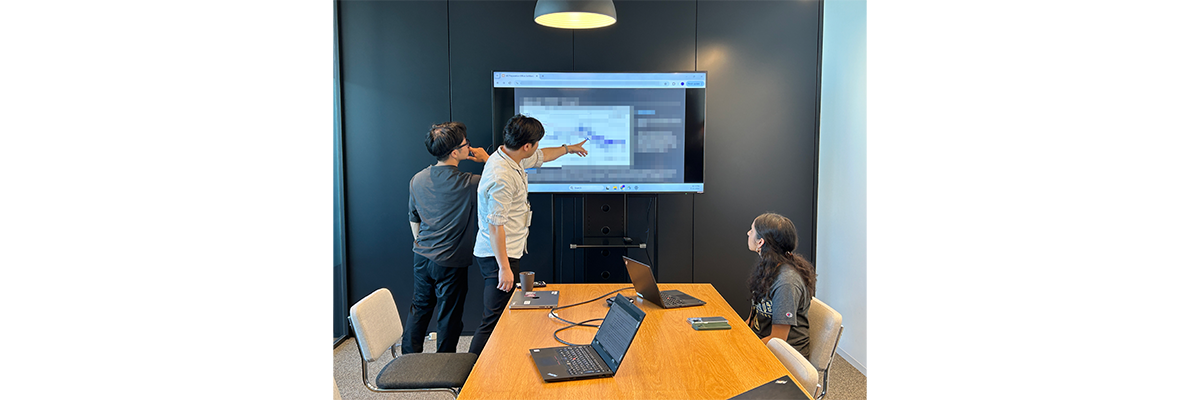
Analyzing my RSRP visualizations with the 6G Preparation Department.
Along with these foundational experiences, I also had many chances to demonstrate my own skills to the department, starting with my self-introduction at the SoftBank R&D Department All-Hands Meeting, which I delivered in Japanese. Building on this introduction, I gave several presentations on my project findings to the 6G Preparation Office and Wireless Systems teams, receiving direct feedback and guidance from the departments.
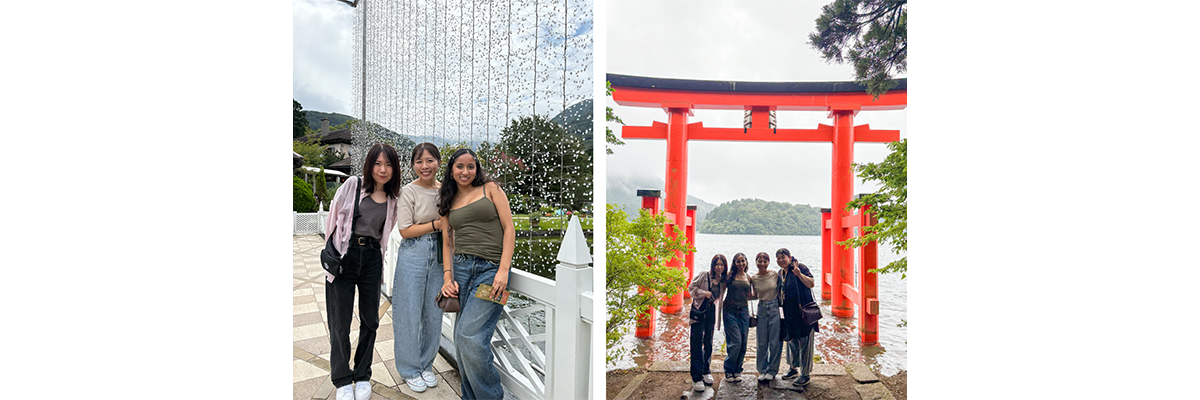
Day trip to Hakone with the Business Planning Department.
Alongside these technical experiences, I enjoyed many memorable experiences with the team that made this internship even more meaningful. In my first week at SoftBank, I joined the department for a Fukuoka SoftBank Hawks baseball game in Tokyo Dome. I also had multiple coffee-chats and lunches with team members that made me feel truly welcome in such a large company and in a country that was new to me. One highlight was a weekend trip to Hakone with the Business Planning Department, where I visited a traditional hot springs and explored art museums. These moments of cultural discovery and genuine connection with my fellow coworkers made my internship at SoftBank not just rewarding, but personally unforgettable.
7. Personal Reflection
Throughout my internship, starting from my very first day, I was treated not as a 19-year-old intern, but as a valued member of the team. Despite being new to all kinds of topics, I was never doubted or discouraged; instead, I was mentored, supported, and challenged in ways that helped me grow as a soon-to-be engineer and as a person. Every expectation I had for this internship was exceeded; every colleague I worked with, across all departments, never hesitated to make time for me, whether it was having small chats on Japanese food recommendations or dedicating hours out of their incredibly busy schedules to guide me through a project. I truly had the best internship experience I could have asked for, here at SoftBank.
Furthermore, working closely with the R&D department gave me the chance to observe key aspects of Japanese work culture. First and foremost, I noticed that every team member, regardless of rank, exhibits incredible work ethic and discipline, while maintaining absolute politeness and patience in every aspect. This combination of values fosters a strong collective mindset across the entire department, where group goals are valued far more than individual recognition. Experiencing this work culture firsthand has given me a new perspective into the qualities I would like to exhibit in my own career journey.
Special Thanks
I would like to express my gratitude to the entire R&D Department at SoftBank for making my internship such a memorable experience, particularly the Advanced Administration, Wireless Systems, 6G Preparation, and Business Planning teams. I am especially thankful to these individuals for their unwavering support and guidance throughout my internship: