
On October 2, 2020, UK-based mobile analytics firm Opensignal announced its Global Mobile Network Experiences Awards 2020, and in its report SoftBank Corp. (TOKYO: 9434) was ranked the global no. 1 carrier for Voice App Experience and no. 3 for Video Experience.
The results raise an interesting question: how do Japan’s mobile networks stack up compared to other parts of the world? SoftBank News took a close look at Opensignal’s findings to explore how mobile network experiences differ by country and region.
- SoftBank Corp. Crowned as No. 1 in the World for Voice App Experience by UK-based Opensignal (SoftBank Corp. press release)
- GLOBAL MOBILE NETWORK EXPERIENCE AWARDS 2020 (Opensignal report)
Networks of 181 carriers in 51 countries and regions evaluated
Opensignal’s Global Network Experience Awards 2020 Report surveyed 181 mobile network operators in 51 countries and regions, as shown in the map below. For Japan, the SoftBank, NTT DOCOMO, au and Rakuten mobile networks were evaluated.

* Map created based on Opensignal report data
Japan’s carriers stand out for network quality
Opensignal is regarded as the wireless industry's largest and most frequent analyzer of the global consumer mobile experience.
The company’s metrics are not based on simulations and predictions. Rather, Opensignal provides apps that collect billions of actual measurements around the clock daily from more than 100 million smartphones worldwide. Network performance at home, work and on the move are all factored into the results. Opensignal’s five evaluation categories are as follows.
|
Video Experience |
Quantifies the quality of video streamed to mobile devices by measuring real-world video streams over an operator's network. Videos tested include a mixture of resolutions and are streamed directly from the world’s largest video content providers. |
|---|---|
|
Voice App Experience |
Measures the quality of experience for over-the-top (OTT) voice services — mobile voice apps such as WhatsApp, Skype and Facebook Messenger. |
|
Download Speed Experience |
Represents the typical everyday download speeds a user experiences across an operator’s mobile data networks. |
|
Upload Speed Experience |
Represents the typical everyday upload speeds a user experiences across an operator’s mobile data networks. |
|
4G Availability |
Shows the proportion of time users with a 4G device and subscription have an LTE connection. |
For Video Experience, SoftBank was edged out by a slim margin to come in at third place and was top among Japan carriers. NTT DOCOMO and au also scored highly in the rankings overall. For Voice App Experience, SoftBank was the global winner, and all the other Japan-based carriers were ranked as global leaders.
While Japanese carriers did not do as well in the Download Speed Experience and Upload Speed Experience categories, they all ranked in the global top five for 4G Availability. Overall, the results indicate that the networks of Japanese carriers are of very high quality when looked at from a global perspective.
More detail on the analysis can be found in Opensignal’s full report.
“Typical usage” regarded as particularly important
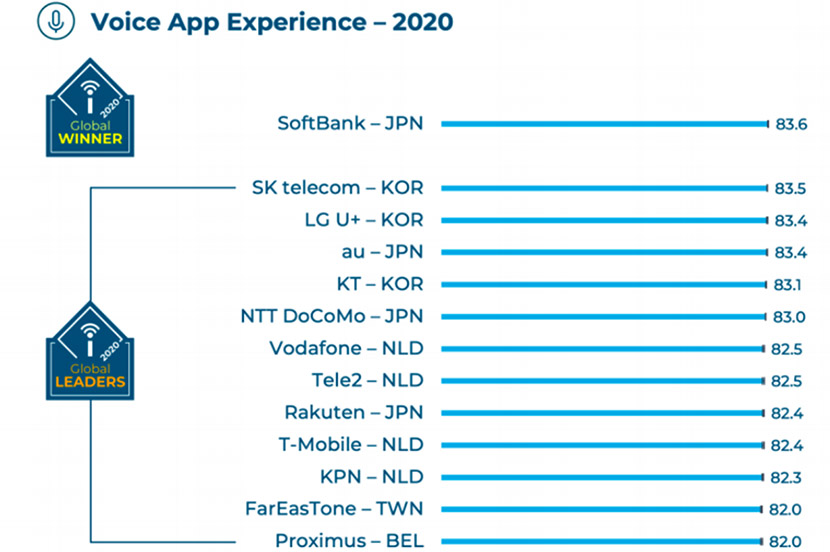
Of the five categories, from a user experience standpoint, Opensignal placed particular importance on Voice App Experience and Video Experience. Voice calls, messaging and video viewing are the most common daily activities for the typical smartphone user, so the amount of stress felt in performing these actions is a major consideration.
As seen in the rankings below, SoftBank and other Japanese carriers scored extremely high in these two key categories.

(Data collection period: January 1 - June 28, 2020)
(Data collection period: January 1 - June 28, 2020)
Looking at the results, some may point out that carriers based in NLD (the Netherlands) also scored highly. While this is true, it should be noted that the Netherlands is made up of a flat landscape with few surfaces high above sea level. By comparison, approximately 75% of Japan’s topography is made up of mountainous regions, and its major cities have extremely high population densities. When considering the relative difficulties for building mobile networks in Japan, the engineers who make it happen deserve a tip of the hat.
What happens when the results are tabulated by country and region and not by carrier? SoftBank News came up with the chart below based on the results from Opensignal’s report. If the scoring results were calculated like they are by media outlets for international sports events, with the Global Winner being awarded “Gold,” Global Leaders getting “Silver” and Global High Performers receiving “Bronze,” SoftBank News arrived at this result.
| Country/region ( ) no. of carriers |
Gold | Silver | Bronze |
|---|---|---|---|
|
Japan (4) |
2 |
9 |
4 |
|
Netherlands (4) |
1 |
13 |
6 |
|
Switzerland (3) |
1 |
3 |
5 |
|
Austria (3) |
1 |
2 |
5 |
|
Canada (3) |
1 |
2 |
4 |
|
South Korea (3) |
0 |
10 |
3 |
|
Singapore (4) |
0 |
9 |
5 |
|
Belgium (3) |
0 |
2 |
9 |
|
Taiwan (5) |
0 |
1 |
13 |
|
USA (4) |
0 |
1 |
3 |
* Table created based on Opensignal report data
While opinions may vary on the methodology used in the above chart, the results clearly speak for themselves.
(Original article posted on October 26, 2020)
by SoftBank News Editors

