Analysis of Operating Results (Full Year)
Consolidated Results
Revenue
-
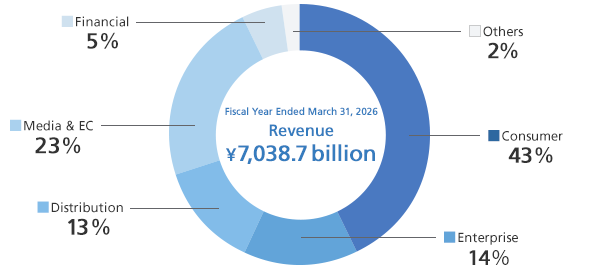
For the fiscal year ended March 31, 2026, revenue increased by ¥494.3 billion (7.6%) year on year to ¥7,038.7 billion, marking a record high. All reportable segments posted higher revenue, with increases of ¥166.8 billion in the Distribution segment mainly due to solid increase in revenue from ICT related products for enterprise customers, recurring revenue products, and products for consumers, ¥80.5 billion in the Enterprise segment mainly due to an increase in demand for solutions associated with digitalization, ¥79.0 billion in the Financial segment mainly due to an increase in gross merchandise value of QR code payments and credit card services provided by PayPay Corporation and PayPay Card Corporation, ¥62.2 billion in the Consumer segment mainly due to increases in revenues from sales of goods and others and mobile, and ¥39.1 billion in the Media & EC segment mainly due to increases in commerce revenue excluding ASKUL Corporation and strategy revenue, despite the impact of the system outage at ASKUL Corporation.
Operating income
-
For the fiscal year ended March 31, 2026, operating income increased by ¥53.6 billion (5.4%) year on year to ¥1,042.6 billion. Operating income increased by ¥44.6 billion in the Financial segment, ¥22.1 billion in the Enterprise segment, ¥20.4 billion in the Consumer segment, and ¥4.8 billion in the Distribution segment, despite a decrease of ¥18.4 billion in the Media & EC segment mainly due to the system outage at ASKUL Corporation.
Net income attributable to owners of the Company
-
For the fiscal year ended March 31, 2026, net income attributable to owners of the Company increased by ¥24.6 billion (4.7%) year on year to ¥550.8 billion. This is mainly due to the aforementioned increase of ¥53.6 billion in operating income and a decrease in income tax. The decrease in income tax is mainly due to the additional recording of deferred tax assets associated with the reassessment of the recoverability of deferred tax assets at PayPay Corporation, while there was an increase in expenses resulting from the absence of the deferred tax impact from business restructuring of associates recorded in the previous fiscal year. Net income attributable to non-controlling interests increased by ¥46.7 billion (36.2%) year on year to ¥175.9 billion, mainly due to an increase in net income at the LY Group (LY Corporation and its subsidiaries), including PayPay Corporation.
Adjusted free cash flow
-
In the fiscal year ended March 31, 2026, primary free cash flow was positive ¥633.6 billion, an increase of ¥30.3 billion year on year. Net cash inflow from operating activities was ¥1,393.8 billion, ¥25.9 billion in cash inflow year on year. This increase mainly reflected an increase in EBITDA and a decrease in necessary working capital such as trade receivables, payables, inventories and others, including those of the banking and securities businesses, while there was an increase in income taxes paid. Net cash outflow from investing activities was ¥1,270.8 billion, an increase of ¥275.6 billion in cash outflow year on year. This increase mainly reflected an increase in payments for acquisition of investment securities in banking business. Cash flows from investing activities include an expenditure of ¥166.9 billion related to long-term growth investments.
- [Notes]
-
- *1
Adjusted free cash flow (excluding LY Group, PayPay, etc.) = free cash flow + (proceeds from the securitization of installment sales receivables – repayments thereof) + dividends received from A Holdings Corporation – investment in PayPay Corporation + proceeds from sales of shares in PayPay Securities Corporation - free cash flow of the LY Group, PayPay, etc. + other items. "LY Group, PayPay, etc." refers to A Holdings Corporation, LY Corporation and its subsidiaries (LY Group), B Holdings Corporation, PayPay Corporation, PayPay Card Corporation, PayPay Bank Corporation, PayPay Securities Corporation, etc.
- *2
Primary free cash flow is a measure calculated by adding back the amounts spent as long-term growth investments to adjusted free cash flow (excluding LY Group and PayPay, etc.). Long-term growth investments include investments in AI computing infrastructure and AI data centers.
- *1
Revenue by segment
Consumer segment
-
Revenue
-
Segment income
Consumer segment revenue increased by ¥62.2 billion (2.1%) year on year to ¥3,015.1 billion. Mobile revenue increased by ¥17.3 billion (1.1%) year on year. The increase mainly reflected year-on-year growth in smartphone subscribers, led primarily by the Y!mobile brand, amid a stable trend in average revenue per user. Broadband revenue increased by ¥10.6 billion (2.6%) year on year. This increase was mainly due to a year-on-year increase in subscribers of the SoftBank Hikari fiber-optic service*3. Electricity revenue decreased by ¥45.4 billion (17.8%) year on year. This decrease was mainly due to a decrease in transactions in the electricity market. Revenues from sales of goods and others increased by ¥79.7 billion (11.2%) year on year. This increase was mainly due to an increase in unit prices of mobile devices.
Operating expenses*4 were ¥2,464.3 billion, an increase of ¥41.8 billion (1.7%) year on year. This increase was mainly due to increases in sales promotion expenses and the cost of goods of smartphones, etc., while there was a decrease in the cost of electricity.
As a result, segment income increased by ¥20.4 billion (3.8%) year on year to ¥550.8 billion.
- [Notes]
-
- *3
Includes subscribers of SoftBank Air
- *4
Operating expenses include cost of sales, selling, general and administrative expenses, and other operating income and other operating expenses.
- *3
Enterprise segment
-
Revenue
-
Segment income
Enterprise segment revenue increased by ¥80.5 billion (8.7%) year on year to ¥1,002.9 billion. Within Enterprise segment revenue, mobile revenue increased by ¥24.8 billion (7.8%) to ¥340.6 billion, fixed-line revenue decreased by ¥2.1 billion (1.2%) to ¥167.3 billion, and business solution and others revenue increased by ¥57.8 billion (13.2%) to ¥495.0 billion. The increase in mobile revenue was mainly due to an increase in mobile device sales from a growth in the number of mobile service subscribers, as well as an increase in telecommunications revenue. The decrease in fixed-line revenue was mainly due to a decrease in the number of telephone service subscribers. The increase in business solution and others revenue was mainly due to increased revenue mainly from cloud and security solutions as a result of capturing enterprise customers'demand for digitalization.
Operating expenses were ¥810.5 billion, an increase of ¥58.4 billion (7.8%) year on year. This increase was mainly due to an increase in costs following the abovementioned increase in business solution and others revenue.
As a result, segment income increased by ¥22.1 billion (13.0%) year on year to ¥192.4 billion.
Distribution segment
-
Revenue
-
Segment income
Distribution segment revenue increased by ¥166.8 billion (18.8%) year on year to ¥1,056.3 billion. This increase was mainly due to solid growth in ICT related products for enterprise customers and recurring revenue products such as cloud and SaaS, which have been strategic areas of focus, as well as increased sales of PCs due to GIGA School Program Phase 2 and migration from Windows 10, which is reaching the end of its support, and solid growth in products for consumers.
Operating expenses were ¥1,021.1 billion, an increase of ¥162.0 billion (18.9%) year on year. This increase was mainly due to an increase in cost of sales associated with the increase in revenue.
As a result, segment income increased by ¥4.8 billion (15.9%) year on year to ¥35.3 billion.
Media & EC segment*5
-
Revenue*6
-
Segment income
Media & EC segment revenue increased by ¥39.1 billion (2.4%) year on year to ¥1,668.0 billion. Within Media & EC segment revenue, media revenue increased by ¥4.8 billion (0.7%) to ¥728.7 billion, commerce revenue increased by ¥8.4 billion (1.0%) to ¥855.2 billion, strategy revenue increased by ¥22.7 billion (44.4%) to ¥73.8 billion, and other revenue increased by ¥3.2 billion (44.8%) to ¥10.2 billion. The increase in media revenue mainly reflected an increase in revenue from account advertising, despite a decrease in revenue from search advertising. The increase in commerce revenue was mainly due to the consolidation of LINE MAN CORPORATION PTE. LTD. and BEENOS Inc., as well as an increase in transaction value of the ZOZO Group (ZOZO, Inc. and its subsidiaries), despite a decrease in transaction value affected by the system outage at ASKUL Corporation in October 2025. The increase in strategy revenue mainly reflected the consolidation of LINE Bank Taiwan Limited.
Operating expenses were ¥1,427.6 billion, an increase of ¥57.5 billion (4.2%) year on year. The reasons for variance are as follows:
- Operating expenses decreased by ¥15.7 billion due to the absence of gains on loss of control over subsidiaries and the recognition of remeasurement gains on step acquisitions.
- Operating expenses at the ASKUL Group (ASKUL Corporation and its subsidiaries) decreased due to the abovementioned system outage.
- Operating expenses increased mainly due to the consolidation of LINE MAN CORPORATION PTE. LTD., LINE Bank Taiwan Limited, and BEENOS Inc.
- Operating expenses increased due to an increase in sales promotion expenses.
As a result, segment income decreased by ¥18.4 billion (7.1%) year on year to ¥240.4 billion.
- [Notes]
-
- *5
From the three months ended June 30, 2025, PayPay Bank Corporation, which was previously classified under the "Media & EC segment," has been transferred to the "Financial segment." As a result, the figures for the fiscal year ended March 31, 2025 have been retrospectively adjusted.
- *6
From the three months ended June 30, 2025, in addition to the LY Group revising its management categories, PayPay Bank Corporation, which was previously classified under the "Media & EC segment," has been transferred to the "Financial segment." As a result, the revenue breakdown of all service categories in the "Media & EC segment" for the fiscal year ended March 31, 2025 has been retrospectively adjusted.
- *5
Financial segment*7
-
Revenue
-
Segment income
Financial segment revenue increased by ¥79.0 billion (24.3%) year on year to ¥404.5 billion. This increase was mainly due to an increase in gross merchandise value of QR code payments and credit card services provided by PayPay Corporation and PayPay Card Corporation.
Operating expenses were ¥318.2 billion, an increase of ¥34.4 billion (12.1%) year on year. This increase was mainly due to an increase in sales promotion expenses related to point rewards, etc., driven by the aforementioned increase in gross merchandise value, as well as an increase in expenses associated with the listing.
As a result, segment income increased by ¥44.6 billion (107.1%) year on year to ¥86.3 billion.
- [Note]
-
- *7
From the three months ended June 30, 2025, PayPay Bank Corporation, which was previously classified under the "Media & EC segment", has been transferred to the "Financial segment". As a result, the figures for the fiscal year ended March 31, 2025 have been retrospectively adjusted.
- *7